Free Sales Productivity Workbook (for Google Sheets & Excel)
Sales is one of the most challenging jobs in B2B SaaS today. In an industry that has demanded outrageous growth, quota attainment simply isn’t a realistic measure of productivity.
Use this sales productivity workbook to create a more accurate picture of productivity trends and team performance.
What you'll learn
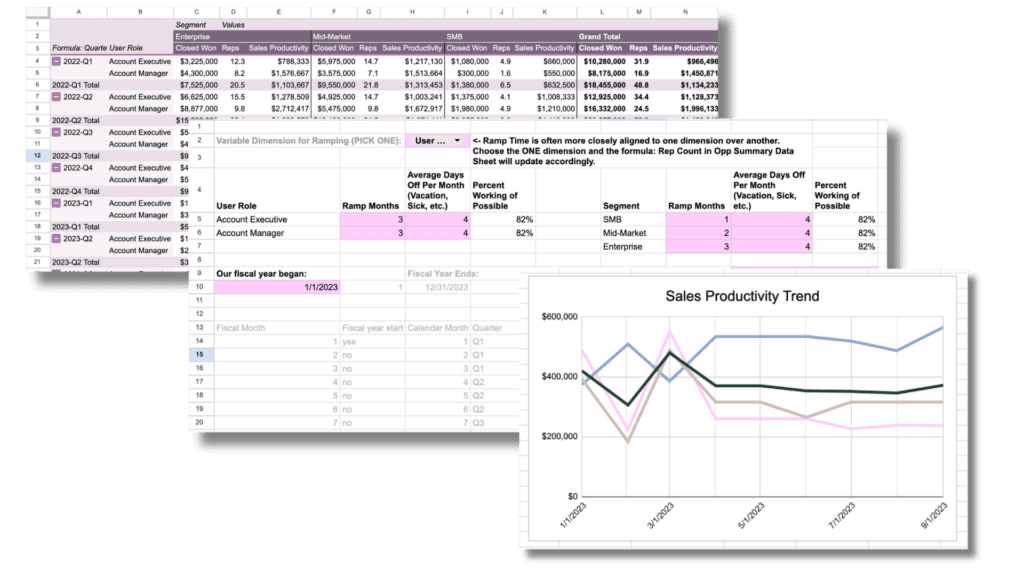
◆ Sales productivity by company segment – if you divide and conquer by your target account company size, this view will allow you to see how productivity differs. It’s a great way to see whether it truly is harder or more profitable to sell into those enterprise accounts.
◆ Sales productivity by user role – if you’d like to see how different sellers perform, this is your view. Simply update the tables as instructed to display your unique roles and you’re good to go!
◆ Sales productivity by quarter – most SaaS companies have quarterly goals, which makes month-over-month performance lumpy. This quarterly view will give you a normalized view of how your team has performed over time.
◆ Understand trends – A moment in time is useful but a trend tells a story. See how things have changed over time.
◆ Spot outliers – when you can see trends, you can more easily spot problems. Now that you know what’s normal, you’ll have an easier time picking up on what isn’t.
Download your FREE
workbook now!
Frequently asked questions
Who is this Sales Productivity Workbook for?
This workbook was created for early-stage B2B startups with a sales team. It can also be used by larger organizations that only want to analyze one team at a time.
There are better solutions for companies looking to simultaneously analyze sales productivity across multiple dimensions. For example, if you know productivity differs by product line, geographic region and vertical, we recommend looking at more sophisticated solutions like Lative.
That said, if you’ve got Excel or Google Sheet chops, these workbooks are a good starting point to build on.
What format is the workbook available in?
You can choose whether to download the workbook in Excel or duplicate a Google Sheet workbook for your use.
Does this workbook only take specific CRM data?
We’ve built the workbook to accept data from any CRM. We’ve also included instructions on how to run the source reports in the two leading CRMs.
How do you calculate Sales Productivity?
At Lative, we calculate sales productivity as the average revenue sold in a given period divided by the number of sales representatives available to sell in that same period. One of the more complicated facets of this equation is determining how many representatives are available to sell. This calculation must consider a ramp schedule and deduct the percentage of time a representative is officially off the clock (whther due to PTO, sick leave, etc.)
For example, if the average fully ramped sales representative takes about three days off in October, your average sales rep would be .86 of a Full-Time Employee (assuming there are 22 working days in October 2023 and they take three days off, 86% of their working hours are potentially allocated to selling).
For more on why and how we calculate Sales Productivity, check out our recent article