
JUMP TO EACH SECTION TO LEARN MORE
- Stress-testing your Sales Capacity Model
- Quotas & ramp schedule
- How does on-time hiring impact capacity?
- How does attrition (turnover) impact capacity?
- How does ramp time impact capacity?
- How does quota size impact capacity?
- Risks, red flags, and hiring triggers
- Continuous capacity planning
- Conclusion
“We need to believe we live in a predictable, controllable world, so we turn to authoritative-sounding people who promise to satisfy that need.”
In prior posts, we’ve stressed the value of having a continuous revenue planning process through the year with the idea that “better never stops”. Our goal here is to share a methodical approach to revenue planning on various time scales, from weekly forecasting to annual strategic planning.
There are six core elements to continuous revenue planning and execution:
- Weekly sales forecasting & pipeline management
- Monthly performance monitoring
- Quarterly performance analysis: Stress testing your sales capacity model
- Quarterly performance analysis: How to run high value quarterly business reviews
- Bi-annual market assessment
- Annual strategic planning
Below, we focus on Quarterly Performance Analysis: stress testing sales capacity model, with suggestions on how to assess how your first quarter has set the stage for the year.
Early in my career, my father-in-law shared a cautionary tale with me. When he was in his 20’s, he was given the responsibility of acting CFO at a tech startup. One of his first tasks was to manage a significant investment for company growth. At his first board meeting, he was asked where the investments were made and my father-in-law confidently said “Treasury Notes”. He waited for high-fives but was greeted with stunned silence. Finally a board member spoke up and grimly said “Son, when we told you to invest our capital in the business, we weren’t f***ing asking you to play it safe, we were asking you to invest in people, process, tools, and training!” Oops.
This story underscores a key responsibility of RevOps. Your leadership and investors have entrusted the Go-to-Market teams with substantial resources. Now that you’ve completed your first quarter, it’s time to evaluate the effectiveness of these investments, comparing actual performance against expectations, and identify both risks and successful strategies that warrant more investment.
Now is the time to speak up, on good news and bad.
The most important things you need focus on as you enter your second quarter:
- Revisiting your Sales Capacity Model
- Delivering and effective Quarterly Business Review (QBR)
We will dissect the anatomy of a great QBR in another blog post, but first things first, today we are going to guide you through what you should be doing with your Sales Capacity model. We’ll also provide some wisdom on how to communicate risks, red flags, and hiring triggers that you might be seeing within your model.
Stress-testing your Sales Capacity Model
“Bad news travels slow” is a phrase I often heard from executives earlier in my career. While I don’t believe this is universally true, it does highlight a common issue: people, including executives, tend to prioritize self-preservation.
Resist the temptation to delay communicating bad news. As you go into your second quarter, be transparent, especially in critical areas such as hiring execution, and the enablement and training of new hires. Act now, rather than waiting to evaluate results in the summer. Now is the time to analyze your year-to-date performance and take corrective actions to ensure you meet this year’s targets. Let’s start by revisiting our sales capacity model.
Your Sales Capacity Model:
In previous posts, we’ve highlighted the importance of the sales capacity model in guiding your business and go-to-market activities. Let’s think about what is most important from a sales capacity model perspective now that you are in your second quarter. What actions should your team prioritize now to have the biggest impact on this year’s performance?
In almost all cases, your teams revenue capacity is most sensitive to the following:
- On-time hiring
- Attrition – both voluntary and involuntary turnover
- New hire ramp time
- Seller productivity
We’ll look at each component, but first, let’s remind ourselves of the basics of a sales capacity model with a simple example. In reality, the sales capacity model that you or your Finance team uses will be much more detailed and will include all members within the GTM organization. You can access these examples here if you want a simple sales capacity model to play with:

Core model assumptions:
Each element, from weekly forecasting & pipeline management to annual strategic planning, is influenced by a well-maintained sales capacity model. To accurately assess team capacity, consider the following core assumptions:
- Quota size
- An estimated Ramp schedule for new hires
- A productivity assumption
- An attrition assumption
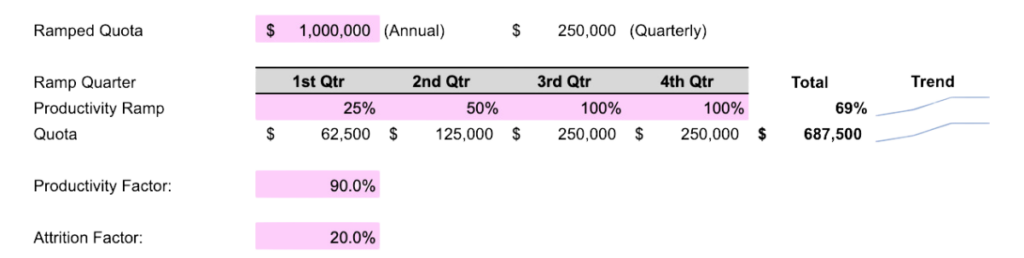
Here’s an example of a team of sellers, each with a ramped annual bookings quota of $1.0M. We’ll explore each of these inputs and assumptions below.
Quotas & ramp schedule:
There are several factors to consider when setting quotas and, like most things, the quotas should be based on benchmarking, rigorous analysis, and a spirit of fairness. In most cases the most effective way to set quotas is to index them to a ramp schedule.
“Ramped” or “Ramping” refers to whether a seller is considered capable of hitting a full quota. For example, a ramped rep might be expected to produce, on average, at least $250k in bookings each quarter.
If we use the schedule in the line, “Productivity Ramp” above, we get the following quotas to assign to the team. This is typically referred to as “Deployed” quota:

Capacity
We’ve now factored in the ramp time for new hires, but to accurately calculate team bookings capacity, we also apply factors for Productivity and Attrition risk. When we do apply this, we get the capacity outlined in the table below. The formula for applying productivity and Attrition risk is: (Quota * Productivity Factor) * (1-Attrition Factor)
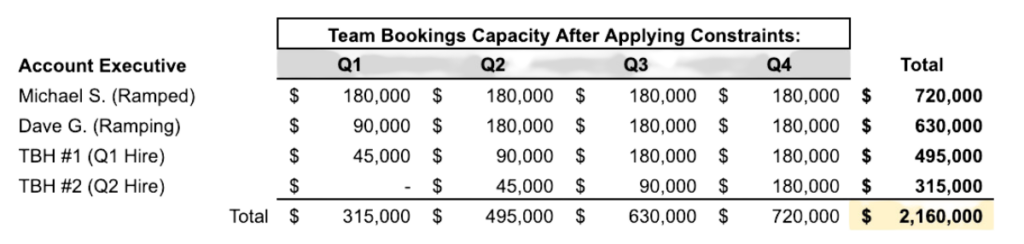
So we see that, even though we plan to issue $3.0M in quota, we only expect to achieve $2.2M in bookings – this is our Capacity. Here’s a bit more on Productivity and Attrition:
Productivity Factor: An important metric to track is Sales Productivity. Most companies target this to be in the range of 80-90%. In other words, you set quotas, but you don’t expect all reps to hit them. So we reflect that assumption here as one of our capacity constraints. If you are unable to calculate your current sales productivity as we describe in this blog (our preferred method), you may use the simple productivity factor, Percentage of Quota Attainment, as an estimate. However, this method depends on the strength of your assumptions.
Attrition Factor: This is an assumption for turnover and vacancy. For example, if a seller leaves and needs to be back-filled, that process could take several months and getting them up to full quota productivity will take several more months — so we reflect that risk in this factor.
How does on-time hiring impact capacity?
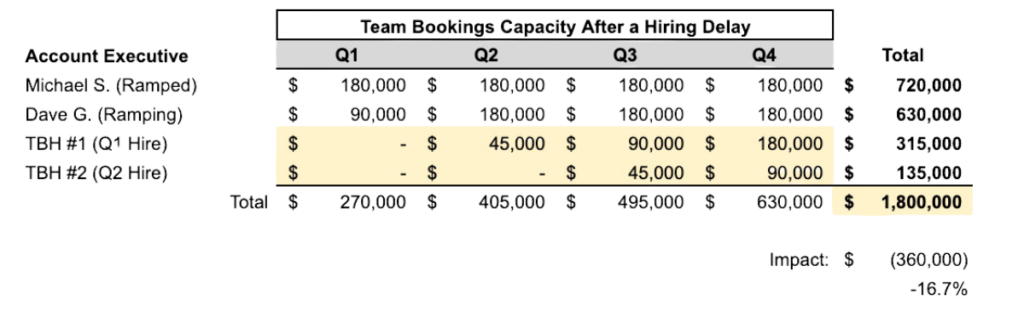
Understanding the impact of hiring timelines on your sales capacity model can reveal crucial insights into potential revenue outcomes. Here’s a scenario we can use to explain the capacity cost of a hiring delay. Let’s imagine that our new hires started one quarter later than planned. In this case, we see that this reduces our team capacity by $360k! In this scenario, a one quarter delay in hiring reduced our expected bookings by 17%. This is why on time hiring is so important for your ability to hit your number.
What you can do to prevent late hiring:
Your sales capacity model is your most effective gauge of team potential and for hitting your year’s revenue target, particularly during a growth phase where you are hiring for sales roles. On-Time Hiring is a critical metric in this model, as recruiting delays significantly affect your capacity, whether filling new positions or replacing turnover. Here are key strategies for success:
- Involve HR and Recruiting Early: Engage your HR and recruiting team in the annual planning process from the start. Clarify the time needed from job requisition approval to new hire start date and plan accordingly.
- Coordinate with Leadership: Maintain close communication with your CFO and CEO to avoid delays in requisition approvals that could affect capacity.
- Strategic Hire Dates: Schedule start dates at the beginning of each quarter. This facilitates planning and allows your training team to organize cohorts of new hires, which is more efficient than staggered individual start dates.
- Monitor Hiring Progress: Track your recruiting efforts weekly with a forecast. Timely hiring, especially for quota-bearing sales roles, is crucial for maintaining capacity.
Start the year with a simple, weekly-updated hiring forecast, with accountability shared between RevOps and the head of hiring. An example of what to include is shown below.
The recruiting team is looking to RevOps for direction, decisions, and leadership in this process. They need to clearly understand the impact each hire has on your company’s ability to hit the plan so that they may triage their team’s priorities.
Here’s what your hiring forecast could look like.
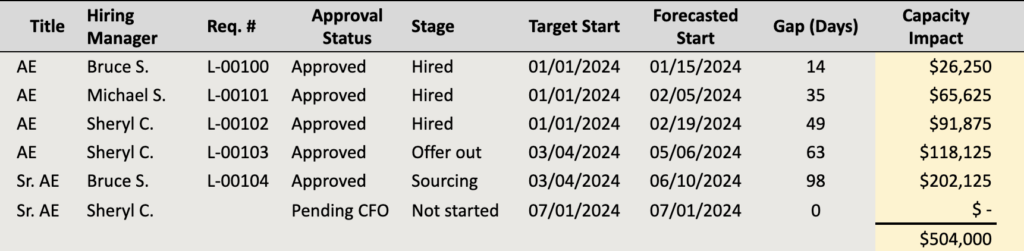
The example above illustrates the impact of hiring delays. Finance and RevOps might align on a hiring plan with expected start dates, but delays frequently arise from the hiring team’s late awareness of job requisitions, challenging timely hiring. In this example, these delays can risk over $500k in annual bookings.
Based on the example above, the clear “alert” message from RevOps to stakeholders should be: “Recruiting delays have reduced our capacity. We need to expedite the start date for Req. L-00104 and immediately approve the open requisition for Sheryl to mitigate risks to our plan.”
What you should do if you do run into late hiring:
Wherever possible, surface a problem with a proposed solution. In this case, if hiring delays have a material impact on capacity, take the lead on suggesting one or two alternatives to your CRO and CFO. One solution might be to accelerate the hires of sellers you were planning to hire later in the year. Another solution might be to delay hiring of a non-quota bearing or “overlay” role, such as a Sales Engineer or a Sales Director/VP. Either way, work in collaboration with finance to come up with the best solution.
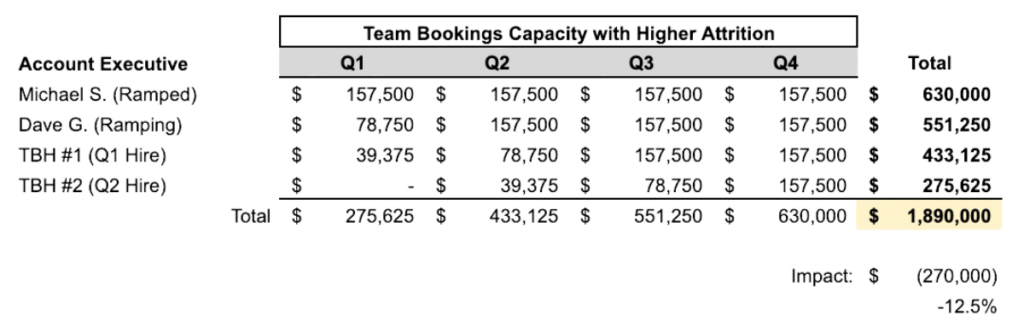
How does attrition (turnover) impact capacity?
In this example, we model that team turnover is higher than anticipated — 30% vs. the assumption we had going into the year of 20%. In this case, the higher turnover has a $270k impact on capacity! Put simply, a 10% increase in vacancy from turnover reduces team revenue capacity by 13%.
RevOps should be looking at attrition early and often. As you close Q1 you should be able to understand if you are ahead or behind your annual assumption for attrition and translate the capacity impact for your executive team.
How does ramp time impact capacity?
Imagine that you put in place a new training program that speeds the time to seller productivity. Well done, imaginary enablement team! If we change first quarter productivity from 25% to 35% and second quarter from 50% to 75% we see that capacity increases by $171k or 8%. This effect becomes even more pronounced if you are in a period of rapid hiring. That’s why improvements to training and enablement can have a huge positive impact on revenue.
What should you do about it?
First, define what you mean by “Ramped” and how you will measure it for your team. Here is a summary of good approaches. This is an area where each different metric can reveal different insights.
- Days to Average Team Productivity: The time it takes, in days, for a rep to achieve the average sales productivity for the team.
- Days to 80% of Ramped Quota: How many months or quarters it takes for a rep to hit at least 80% of a fully ramped quota for that time period.
- Days to build $x of qualified Pipeline: How long it takes, in days, for a rep to build a certain amount of qualified pipeline. For example, to have a 4x coverage ratio on a $250k quarterly target, reps may be measured on how quickly they build $1m in qualified pipeline.
Another important thing to do is ensure that you have a 90 day onboarding process that tracks key training and pipeline building milestones. All new reps should have check-ins at 30, 60, and 90 days so that they can understand whether they’ve built enough pipeline and how much they should have built by the next 30 day check-in.
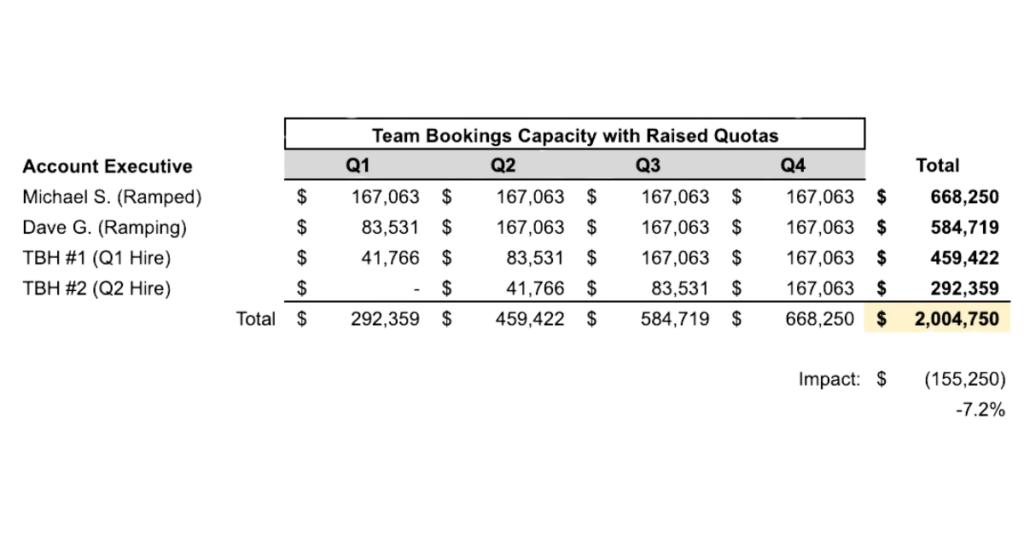
How does quota size impact capacity?
Too often we see Executives look at a revenue shortfall, whether it’s in the annual planning process or in mid-year check-ins, and suggest that quotas be raised as a way to motivate teams to cover the gap. There are a lot of factors that go into quota setting, but raising quotas to address a capacity gap can be disastrous. This can be a sensitive discussion but RevOps needs to demonstrate, through data, that raising quotas without other systemic improvements does NOT increase seller productivity.
Here’s an example of how raising quotas can actually reduce team capacity. If we model a 10% increase in Quota from $1.0M to $1.1M, we should assume that our productivity factor goes down by 10% from 90% to 81%. Also, quota increases are not popular! Some sellers might leave out of frustration over bigger quotas. Other sellers might be let go for not hitting the higher quotas. If we raise quotas to $1.1M, but counterbalance this by dropping productivity to 81%, and raising attrition to 30% we see that capacity actually goes down by $155k or 7%. Beware of unintended consequences and use your sales capacity model to challenge assumptions.
Risks, red flags, and hiring triggers
A great sales capacity model lets RevOps swiftly pinpoint risks and opportunities within the business.
Here’s a brief summary of key areas:
- Business Risk Due to Hiring Delays: Assess the potential outcomes if current trends continue and explore strategies to close the gap.
- Capacity Gaps Due to Seller Productivity: Evaluate the accuracy of productivity assumptions and identify which sellers are exceeding or falling short of performance expectations.
- Effectiveness of New Hire Onboarding: Monitor the success of onboarding programs in bringing new hires up to productivity.
- Hiring Triggers: Use your tools and analysis to identify which teams and areas are performing well enough to justify hiring more sellers to maximize revenue.
Continuous capacity planning
A sales capacity model is vital for measuring team performance, yet often it’s only reviewed during annual planning or a mid-year review in July. This might be due to the complexity of the existing model or limited exposure of sales leadership to the planning process handled by Finance. A robust capacity planning framework should include:
- An easy-to-update modeling tool with standardized definitions across Sales, Marketing, Customer Success, and Finance.
- Joint usage of the modeling tool by RevOps and Finance to avoid discrepancies.
- Quarterly and ad-hoc reviews of the sales capacity model and its core assumptions to ensure accuracy and relevance.
- Real-time data availability to provide current and year-to-date performance insights.
If you lack these capabilities, consider implementing a tool like Lative to automate and streamline the process.
Conclusion
“Planning is important, but the most important part of every plan is to plan on the plan not going according to plan.”
Jim Collins, stressed the importance of communicating bad news in his book, “Good to Great.” The book was written in 2001 but Collins’ observations are enduring guideposts for RevOps leaders. Maybe you’re celebrating overwhelming success from your first quarter, awesome! [wait was he being sarcastic?] Maybe however, like a lot of us, you’re seeing some red flags in your first quarter performance data. Here’s some good advice (adapted for RevOps) on communicating risks and bad news from Jim Collins:
Confront the brutal facts: RevOps leaders need to have courage to face the stinky truths about the current business performance. This involves collecting data and understanding that the data might not fit the plan that you carefully designed.
Dialogue and debate: with your RevOps team and in QBRs with your peers, encourage a culture of rigorous discussion without fear of reprisal. This helps in communicating bad news at a time when you can still do something about it.
Lead with questions, not answers: ask probing questions, don’t just push top-down directives.
Build redundancy and a margin of safety: a great planning process includes planning for bad outcomes with risk mitigation plans – this softens the impact when bad news inevitably comes. A good capacity tool helps you with this safety planning.
Remember, a well-structured sales capacity model is foundational to not just planning but also to adapting when things don’t go as planned. Good luck this quarter and let us know how we can help!
For additional insights into maximizing Sales Performance, Efficiency and Planning, explore our previous blog series. This resource offers in-depth strategies and tips that complement the practices outlined here, guiding you towards operational excellence.