
CEOs, CFOs, Sales Leaders, and RevOps leaders must foster a culture of continuous revenue planning, sales forecasting and performance monitoring and refinement to the annual plan. This starts as soon as you’ve completed your Company kick-off events. From seed to maturity, here are some best practices to keep the momentum you built with the annual plan that you just rolled out.
JUMP TO EACH SECTION TO LEARN MORE
“Great things are done by a series of small things brought together.”
– Vincent Van Gough
This quote captures the heart of Revenue Operations (RevOps). A great RevOps function isn’t merely the result of a single initiative. It’s a blend of continual improvements around people, process and pipeline. Nowhere is this more true than with strategic planning. What’s more, great RevOps teams know that planning never stops. This guide offers insights into Go-to-Market (GTM) planning across different business growth stages and at different cadences – monthly, quarterly and annually.
Most selling environments change quickly, tight collaboration between revenue/sales operations and finance teams has never been more critical. Continuous planning and sales forecasting act as the glue that connects a top-down strategic vision with bottom-up execution and data-driven insights. This collaborative approach not only ensures that both teams stay aligned with the overarching corporate objectives but also allows for agile responses to market forces and changes in team performance.
The key objectives of a continuous planning process are clear: to maintain alignment across departments, adapt strategies to real-time changes and guide the execution of annual and quarterly plans. Far from being a one-time event, planning is a cyclical process that demands regular review, analysis and adjustment throughout the year. This ongoing cycle reinforces the idea that “planning never stops”. It’s not something we put on the shelf after we roll out the annual plan, rather, it’s an ongoing effort that picks up on key business signals and lets us pivot as needed to optimize sales productivity.
There are five core elements to continuous revenue planning and execution:
- Weekly sales forecasting & pipeline management
- Monthly performance monitoring
- Quarterly performance analysis
- Bi-annual market assessment
- Annual strategic planning
This month, we focus on 1 and 2 above, specifically what you should be doing in the first quarter of your operating year.
1: Sales forecasting & pipeline management
“If you don’t have time to do it right, when will you have time to do it over?”
– John Wooden
When my six-year-old son asked what I do for work, explaining my role in Revenue Operations was a challenge. I simplified it for him: “Daddy predicts the future.” This concept is crucial no matter your company’s development stage. Moreover, great forecasting is not just about predicting the future, it’s about capitalizing on opportunities and minimizing surprises. Having a consistent, repeatable method to forecast business performance is key to success. Leaders need to know weekly if their pipeline has enough opportunities to support growth.
Your task as a Sales or RevOps leader: build a constructive communication structure that embraces the need to review, challenge and substantiate the sales pipeline every week.
Why continuous planning and sales forecasting matters:
Headcount decisions
- Hiring and resource allocation pivot around accurate planning and sales forecasts.
Consistency
- Regular, consistent reporting keeps everyone aligned.
Building confidence
- For stakeholders, from employees and board members to investors and the market at large
Facilitating sellers
- A clear plan and forecast aids sales teams in prioritizing and strategizing.
Optimal resource utilization
- From customer success and solutions architects to executives, everyone benefits.
Data over subjectivity
- Rely on a quantitative, unbiased approach rather than gut feelings.
The consequences of poor planning and business forecasting can be dire. Overestimating can lead to over-investment, higher burn rates, or even layoffs, especially during the seed and growth stages. Underestimating results in missed opportunities and could suggest untapped growth potential.
Sales forecasting: by company growth stage
Below, you’ll find our guide to effective forecasting and pipeline management. If you don’t have a sales forecasting process documented, feel free to use this. At least take a peek at what your peers are doing as a best practice.
1. Seed stage: setting the groundwork
Requirements:
Documented pipeline stages: each stage reflects the deal’s progression. These stages guide managers in assessing deal close dates and what’s needed for progression. Everyone from sellers to board members should understand these stages.
Forecast categories: define your categories in CRM. Examples include Commit, Probable, and Upside. Each category reflects confidence levels in deal closures.
Deal inspection: all deals undergo a weekly structured review, assessing risk factors, next steps, and key fields.
Pipeline review: after individual deal inspections, evaluate the overall pipeline health. Understand the pipeline volume relative to sales goals.
Rolling 2 quarter forecast: updated weekly. A mature process may reduce this frequency, but it should remain efficient and quick.
Output: start with a CRM or a basic spreadsheet.
Measure: aim for a pipeline coverage >4x for new deals. Forecast accuracy should be within +/- 10% of week 2 forecast. Always review, challenge and substantiate deals in a constructive environment.
2. Growth stage: scaling and refining
Requirements (includes all requirements from the Seed Stage plus):
Clean opportunity checklist: every deal should meet certain criteria for accuracy.
Processes for customer success and professional services: forecast processes for renewals, expansions, and services can mirror new business processes with slight modifications.
Sales methodology integration: incorporate a proven sales methodology into your stages and forecasting process.
Weekly pipeline generation reviews: include marketing and demand generation leaders. Assess pipeline contributions from different sources.
Output: transition to a CRM forecasting module. Spreadsheets become less effective as the business grows.
Measure: implement a Pipeline Inspection Dashboard. Regularly review pipeline in QBRs. Target forecast accuracy within +/- 5% of week 2 forecast.
3. Maturity stage: advanced sales forecasting for expansion
Requirements (includes all requirements from the Seed Stage and Growth Stage, plus):
Advanced forecasting techniques: this includes weighted forecasts, historical pacing, capacity-based forecasts, predictive statistics and deal score forecasts.
Output: either a CRM or a third-party AI tool is recommended.
Measure: sales forecasting accuracy becomes a key performance indicator.
In summary
Sales forecasting isn’t just a task; it’s an art that combines quantitative data with insights. As businesses progress through different stages, the approach to sales forecasting must evolve, becoming more nuanced and data-driven.
Continual investment in refining your sales forecasting process is crucial. Start today – evaluate your current sales forecasting practices and see where you can introduce these best practices. Remember, the clearer your forecast, the clearer your path to success.
2: Implementing and monitoring the strategic plan
“In God we trust, all others must bring data.”
– W. Edwards Deming
Welcome back from your annual company or sales kick-off event. Phew! You’re exhausted and relieved. Hopefully, you’ve laid out a clear plan for the Go-to-Market teams, explaining the past, present and future goals for the organization. Most importantly, each team member understands how their individual efforts are vitally important to achieve these objectives. Now is the time for Revenue Operations and the Chief Revenue Officer to work closely to adhere to this plan, all while spotting and responding to risks and opportunities in a timely and efficient way.
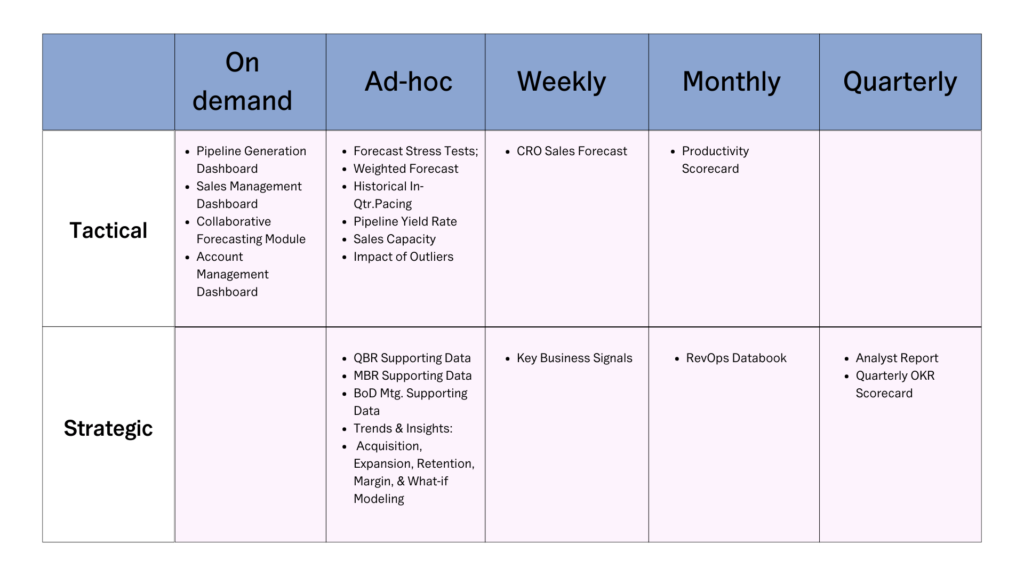
A strong Reporting and Analysis Framework is critical for optimizing revenue operations and sticking to the plan. This framework needs to include a variety of reports and updates, ranging from on-demand and ad-hoc to regular weekly, monthly and quarterly analyses. Essential tools such as a pipeline generation dashboard for insights, a sales management dashboard for performance tracking, collaborative sales forecasting for financial alignment and account management dashboards for client oversight should be integrated into this framework.
Forecast stress tests are key for assessing sales forecast reliability, using metrics like:
- weighted forecasts
- in-quarter pacing
- pipeline yield rate
- predicted sales capacity
- the impact of very large deals
The CRO forecast adds an executive-level perspective to sales forecasting.
The productivity scorecard evaluates the sales team’s efficiency and effectiveness, supporting data-driven decision-making in quarterly business reviews (QBRs), monthly business reviews (MBRs) and board meetings, with a push towards automating these processes.
Trends & insights are vital for focusing on key areas such as acquisition, expansion, retention and margin analysis, with automation ensuring timely strategic decisions. The RevOps Databook and Analyst Report compile operational data for a complete view of performance, while a quarterly OKR scorecard tracks strategic progress, ensuring organizational alignment.
Here is an example of what a robust reporting & analysis framework looks like within RevOps. Don’t reinvent the wheel! CRM tools like Salesforce Sales Cloud have a lot of standard reporting available within that can automate tactical reporting.
Platforms such as Lative can provide rich, automated insights around Sales Efficiency, Performance and Capacity. If you are still struggling to put this into practice, we can help – reach out and we’ll provide you with the guidance you need to succeed.
Example Reporting & Analysis Framework
In summary, a successful reporting and analysis framework for revenue operations must be multifaceted, incorporating real-time dashboards, stress tests for forecasts, productivity measures, and trend analysis. By leveraging these tools, organizations can ensure alignment, adaptability, and informed decision-making, driving strategic execution and operational efficiency.
Key metrics and timelines for effective measurement and reporting
For RevOps leaders, closely monitoring key metrics on a weekly and monthly basis is essential for aligning execution with strategic plans and achieving growth targets. Weekly checks should focus on immediate indicators such as bookings (new, expansion, renewals, and professional services), ending Annual Recurring Revenue (ARR), pipeline status (new and expansion), net pipeline creation and customer retention figures. These metrics help in making quick adjustments to stay on course for the quarter.
On a monthly basis, the analysis becomes more comprehensive, including metrics like ARR, detailed bookings, contract renewal rate, dollar retention rate, customer gains and losses, average deal size, sales rep productivity, sales capacity, and pipeline analysis. This deeper examination, enriched with analyst commentary, tracks adherence to the plan and evaluates the business’s long-term health and efficiency. By systematically reviewing these data points, leaders can ensure their teams are effectively progressing towards strategic goals.
The important thing to understand and convey to executives is that there are dozens, sometimes hundreds of metrics that can be tracked but we are interested in the ones that relate directly to this year’s GTM Strategy and Plan.
Below are examples of the key metrics that a SaaS company might include on a weekly and monthly cadence.
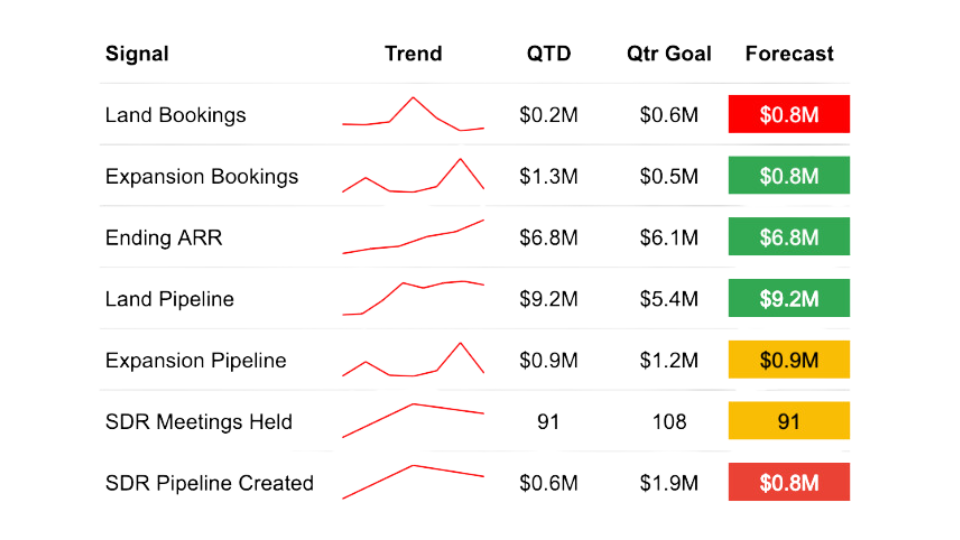
Example: weekly key business signals:
- Bookings: new, expansion, renewals & prof. svcs.
- Ending ARR
- Pipeline — new + expansion
- Net pipeline creation
- Top 10 deals remaining to close this quarter
- Top 10 accounts at risk renewals this quarter
- Contract renewal rate
- Dollar retention rate
- Churn rate
- New logo churn
Example of how this might look in a weekly summary of key business signals:
Example: monthly “DataBook” of business trends:
- Ending Annual Recurring Revenue (ARR)
- Bookings → split by land, expand, NACV, RACV, etc.
- Contract renewal rate
- Dollar retention rate
- Gross revenue retention
- Customers added vs. lost
- Avg. deal size (ADS)
- Avg. ARR per customer
- Sales productivity
- Sales efficiency
- Sales capacity
- Average ramp time for new sales reps
- Pipeline volume & coverage ratio → split by new & expansion
- Pipeline win rate % & yield rate %
- Pipeline coverage ratio
- Pipeline conversion rates
- Net pipeline creation
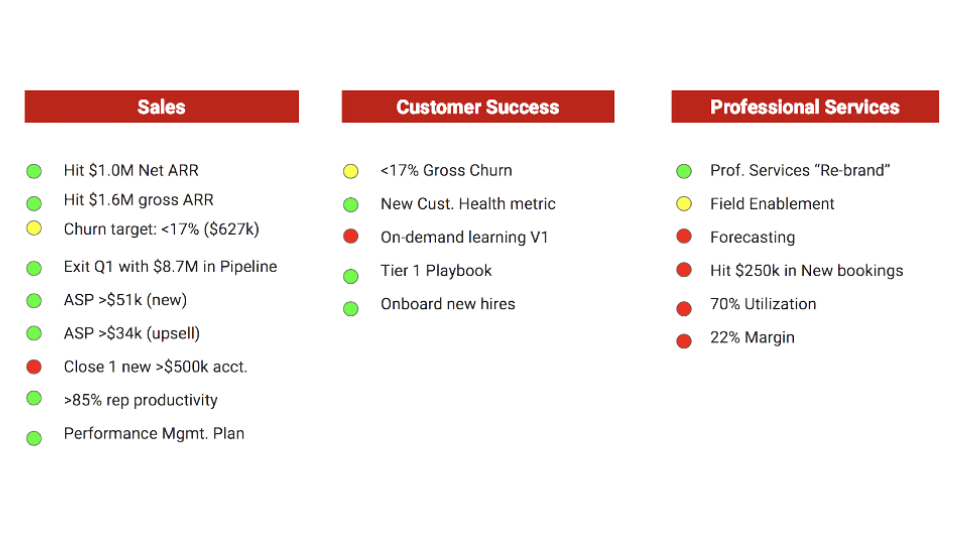
Example of how this might look in a monthly / quarterly scorecard:
Following your strategic plan requires precise tracking and responsive adjustments. A solid framework of dashboards, stress tests and scorecards enables you to monitor crucial metrics and timelines effectively. This setup not only ensures you’re on track but also highlights opportunities for improvement. The “so what” here is clear: without these tools, you risk missing out on growth opportunities and failing to meet your strategic goals. Trying to do too much however can mean that stakeholders have too much data to ingest and your team might suffer “analysis paralysis”.
To get started, prioritize setting up your reporting and analysis framework, focusing on the most critical metrics for your business. This foundational step is key to navigating your strategy successfully and making informed decisions that drive your organization forward.
Key takeaways for in-quarter success
In conclusion, continuous revenue planning is crucial for staying on course with your annual strategy while adapting to market changes. Regular sales forecasting and in-depth reporting enable your team to make timely adjustments and informed decisions, ensuring your revenue operations remain aligned with strategic goals and market realities.
Leverage tools like Lative to streamline these processes, making your planning more efficient and responsive. By adopting a cycle of constant evaluation and refinement, you’ll maintain momentum, drive growth, and avoid the pitfalls of static planning. Remember, the success of your annual plan hinges not just on its creation but on its continuous evolution throughout the year.
For additional insights into maximizing Sales Performance, Efficiency and Planning, explore our previous blog series. This resource offers in-depth strategies and tips that complement the practices outlined here, guiding you towards operational excellence.