Understanding your true sales performance is critical to setting, hitting, and exceeding targets.
It all comes down to knowing where you stand. If you’re tracking at or above your expectations, what can you do to perform even better? If you’re tracking below expectations, what areas need optimization or investment to get you back on track?
To manage your sales organization effectively, you need accurate insight into performance across the organization, whether by region, product line, or type of business to help you identify strengths, weaknesses and opportunities to improve.
Doing this the right way is the core foundation to building a high-performing and efficient revenue engine.
In this post, we’ll share essential industry best practices to measure, manage and elevate your sales team’s performance that are essential for any sales team.
JUMP TO EACH SECTION TO LEARN MORE
- Why focus on sales productivity
- Where not to start: using quota attainment
- A better starting point: sales productivity
- How to calculate sales productivity: simple formula
- How to calculate sales productivity: advanced formula
- Insights from regular productivity analysis
- Top 3 ways to improve sales performance
- Supercharge your sales engine for sustained sales success
Why focus on sales productivity

Managing the Strategic Evolution of Sales Operations. Forrester Research, 2020.
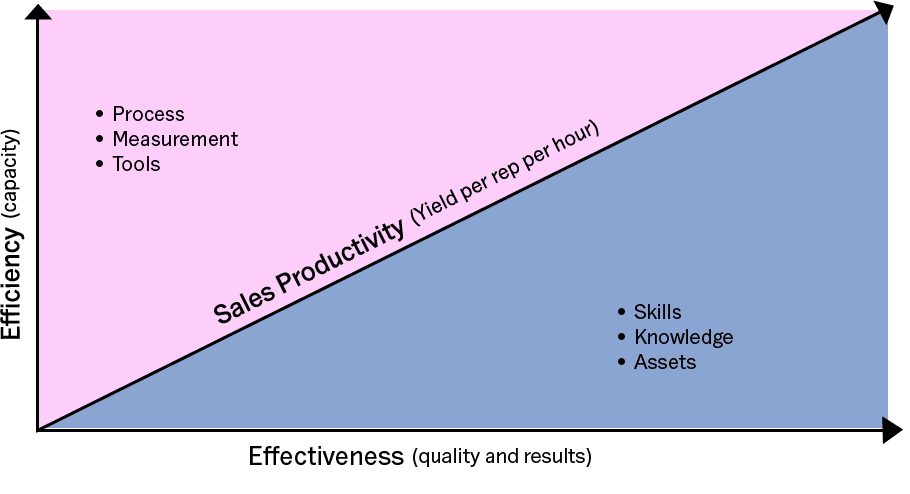
”Sales and sales operations leaders often struggle to define sales productivity, defaulting to such measures as the number of sales reps who achieve quota, the size and conversion rate of opportunities in the pipeline, or the win rate for qualified opportunities. All of these metrics are important, but they rarely appear as corporate level goals, which are typically stated as revenue and operating margin. The ultimate yield, or result, of the sales organization is revenue and profits. Defining sales productivity as the yield per rep per unit of time directly links the goal of increasing sales productivity to corporate-level goals. The efficiency, or yield per rep per hour, with which the organization can achieve results is directly related to operating margin (i.e., profitability)”
Managing the Strategic Evolution of Sales Operations. Forrester Research, 2020.
Where not to start: using quota attainment
1. Inaccurate statistic
The last couple of years has been difficult, but this has been going down consistently for years. So, if quota attainment is that far off what salespeople are actually able to produce, it shouldn’t give us much confidence in its accuracy. Quotas are also mostly set once a year which is fundamentally flawed given how fast business changes today.
2. Quota methodologies vary widely
There are a lot of variables that go into setting quotas. To share one of my own experiences, when I ran RevOps for Citrix a few years back, I always struggled with this approach. We had a number of salespeople in each of the geographies, and we’d roll out new quotas at the start of the year. Within the first month, we’d get that email from our sales leadership team requesting quota adjustments in one or more territories for a variety of reasons. And now suddenly we had inconsistencies with how quotas were set across the regions, and it become very difficult to objectively benchmark the teams within the organisation.
3. Inconsistent and unstable metric
And the beginning of the year was just the beginning. More quota changes continued to roll in as the year went on and by the time we were halfway through the year, there would be upwards of 30+ quota changes across the organization for a variety of reasons. This creates an extremely inconsistent and unstable metric by which to measure and compare sales performance.
So, trying to use quota attainment to measure sales performance at a high level may give you some indications as to how things are going generally. But, when we start to drill down to measure performance on a more granular level by region, type of business (new, renewal, upsell) or other dimensions of your organization it becomes very difficult to compare them objectively and make informed decisions.
A better starting point: sales productivity
When we shift our focus from quota attainment to sales productivity, we get a clearer, more actionable picture. Let’s look at what makes sales productivity a more reliable metric and why it should be the foundation to any organisation for measuring sales performance.
Defining sales productivity
We define sales productivity as the amount of revenue a salesperson generates per unit of time, or in more technical terms, the yield per rep per unit of time.
Why sales productivity is so important
1. Stable baseline
- Unlike quotas that are subject to frequent changes, sales productivity gives us a consistent, stable and objective performance baseline based on actual operating data
2. Broad applicability
- Sales productivity can be applied across business dimensions for even the most complex organization structures, allowing for a comprehensive analysis that goes beyond mere quota attainment
- When you look at it across teams, regions, or product lines, you can measure the average productivity per person for that group of salespeople
- The larger your team, the harder it gets to move the overall average unless something fundamental changes in the business
3. Trend analysis
- Sales productivity is a metric that can be trended over time
- This is crucial for us in RevOps, enablement and other support functions like Product
- We aim for a productivity trend that's either flat or trending up
- A downward trend, often tied to new initiatives, or an influx of recent sales hires, should ring alarm bells and trigger a deeper dive into what issues may be causing it like not over hiring
4. Real-time insights
- This metric gives you real-time insights into opportunities and risks
- It helps pinpoint where productivity is rising, where it's falling, and what to do about it
5. Foundational for building sales capacity plans
- Accurate and granular measurement of sales productivity is the core input needed for building a realistic bottoms-up sales capacity plan
Sales productivity informs strategy
Measuring sales productivity does more than just provide a snapshot of revenue generation; it reflects the operational health of the sales organization. It gives you an accurate and objective view of where you stand and the ability to make well-informed strategic decisions to elevate performance.
How to calculate sales productivity: simple formula
If you’re not already measuring sales productivity today, here’s a simple formula to help you get started. Note that this simple formula works relatively well for small sales teams only. We’ll cover a more advanced formula for larger, more complex and/or fast-changing teams right after this.
Simple formula at a glance
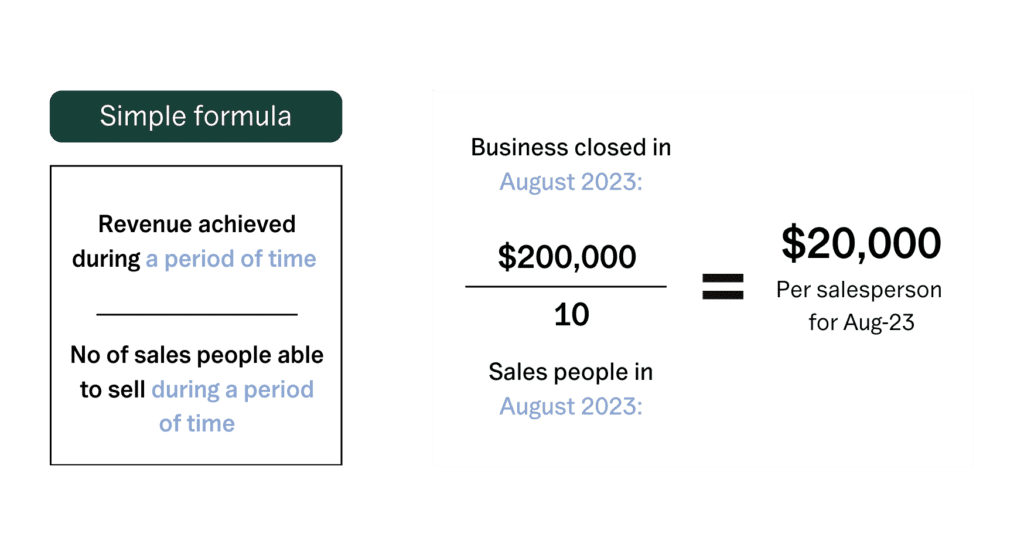
The below figure shows a simple formula for measuring sales productivity, along with a hypothetical example of what this looks like when you apply numbers.

Formula inputs
1. Revenue achieved
- The total revenue your sales team achieved during a specific timeframe (closed won business)
- This could be per day, week, month, quarter, or even year, depending on the nature and velocity of your sales cycles
2. Number of salespeople
- The number of salespeople during that period
- This gives you a denominator to understand the average revenue generation capacity per salesperson
Simple formula example
As the example above illustrates, if your business closed deals worth $200,000 in August 2023, and during that month, you had 10 salespeople on board, you can see that, on average, each salesperson generated $20,000 in revenue for your business in August 2023.
How to calculate sales productivity: advanced formula
Now that we have a simple baseline method for calculating sales productivity, to increase the accuracy and usefulness of this performance metric we need to get more granular.
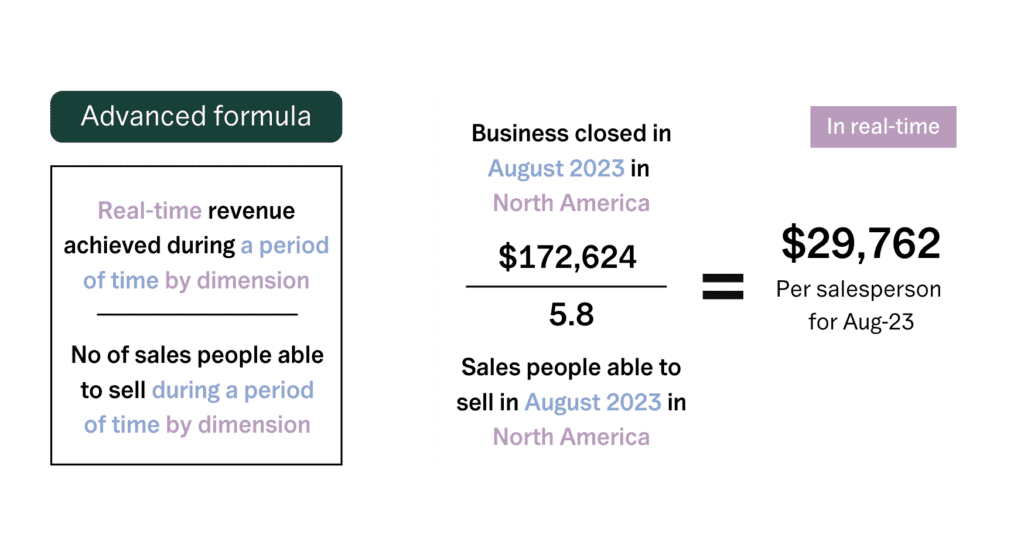
To do this, as shown in the figure below, you want to start looking at revenue achieved during the current period in real-time and by business dimension and how many salespeople were able to sell.

The advanced formula: key differences
1. Real-time revenue by dimension
- Now, we're not just looking at total revenue, but dissecting it by specific business dimensions - regions, market segments, types of business, product lines, or any other dimensions that may be relevant for your business
- This provides a more granular view of where and how revenue is being generated which you can use to benchmark and compare performance
2. Salespeople able to sell by dimension
- Here we’re no longer just looking at how many salespeople you have at the end of a period, or even the average headcount between the beginning and end of the period
- We need to look at how many salespeople in full-time equivalent (FTE) terms were actually able to sell in each dimension during the specified period
- This should account for variances like attrition, vacation, maternity leave, transfers, hybrid roles, hire dates and other factors, all of which can have significant impacts on sales capacity throughout the period
3. Factoring in ramp productivity
- A further breakdown to salespeople able to sell can be made by distinguishing between ramped and ramping productivity
- This allows for a more precise evaluation of how fully ramped salespeople are performing as opposed to those who are adjusting to a new role
- A fully ramped salesperson will have achieved or exceeded the average sales productivity for the dimension being measured, while new or partially ramped salespeople will be producing less based on how long they’ve been in their role and how well onboarding and enablement programs are functioning
Advanced formula example
Now let’s tie this back to the example in the figure above.
In North America, during August 2023, the business closed deals amounting to $172,624. However, the total salespeople able to sell during this period was 5.8 (actual full-time equivalents after allowing for those on leave, newly hired, partially ramped, etc).
This shows us that each salesperson (in FTE terms), on average, generated $29,762 in revenue for the North American market during this month.
This is a big difference compared to the $20,000 per salesperson from the simple formula, which is often what we see businesses applying if they’re doing any productivity analysis.
Higher accuracy is more actionable
The granularity of the advanced formula yields a much more precise and actionable understanding of the actual performance of your sales organization by each business dimension. It’s not just about the broader picture anymore. It gives you an accurate way to benchmark the effectiveness of sales execution across dimensions so that you can make decisions and investments into the areas and initiatives that will have the biggest impact.
But as your revenue organization grows and changes, this can get very complex. Even small organisations can struggle with these calculations, so often they are only run periodically if at all. This has to change if we are to build high performing sales organisations that are revenue efficient and ensure we hit our goals.
Going back to my time at Citrix, we had 2 analysts working full-time just trying to accurately measure the sales productivity and produce weekly KPI reports, which were then reviewed by the Go-To-Market team every Friday.
This frequency enabled us to grow from $350m to $800m in just four years. How? The speed at which decisions could be made and seeing the impact of those decisions weekly instead of waiting for the next QBR or annual planning cycle to come around.
Running the productivity data frequently also opened the door to setting accurate monthly and quarterly quotas which could be adjusted both up and down for the next quarter depending on the sales performance. This created a far healthier sales organisation that was high performing and being rewarded fairly for their performance.
And finally, it enabled us to track sales capacity against plans frequently to ensure we were hiring in the right places at the right times throughout the year to hit our targets.
Insights from regular productivity analysis
So now that you know how to accurately measure and track sales productivity across business dimensions in real-time, let’s look at some of the key insights and benefits you gain that you can then apply to improve your sales planning, performance and execution.

1. Benchmarking performance in real-time
- You can objectively measure and compare relative sales performance and what your team is able to produce across various dimensions as it happens - whether those are territories, teams, products, types of business or even individuals
2. Spotting performance variance
- You can easily identify areas of over and under-performance
- By comparing productivity metrics, it's easier to spot where things are going well, where they aren’t and start to focus on what you can do about it
3. Evaluating enablement initiatives
- You can measure the impact of rolling out new enablement and training programs and/or technology tools
- By benchmarking productivity before and after such initiatives, their effectiveness can be evaluated
- If you see an upwards tick in your productivity trend, they’re working, if you see productivity drop you should consider stopping and re-evaluating
4. Understanding organizational dynamics
- You can immediately begin to gauge the effects hiring, organizational changes, and attrition on sales productivity and use these insights to inform plans
- It means that you can be tracking your current sales capacity as it changes throughout the year and adjusting your capacity plans and hiring priorities as often as needed
5. Assessing ramp times accurately
- You can get a much more precise measurement of ramp times for new team members and better understand when they will start to affect sales
- This is essential for better planning and expectation setting both within the sales team and the organization at large
Accurately measuring sales productivity in real-time should be the core KPI that you use to continuously track and improve sales performance. Every investment you make or initiative you launch will affect sales productivity in some way and by tracking these impacts in real-time, you have an early warning system to tell you what is working, what isn’t working and to help you decide how to adjust.
Top 3 ways to improve sales performance
Now that you’re able to accurately and objectively measure sales productivity, let’s take a quick look at the top drivers to improving your overall sales performance and how you can use sales productivity to inform your plans.
1. Strategic hiring
By understanding where you’re performing well and where you’re not on a granular level in real-time, you can make much more confident decisions and hire the right people in the right places at the right time to ensure you hit your target. This is no longer limited to an annual planning exercise but is now something you can be evaluating and acting on throughout the year as things change in the business.
2. Sales enablement programs
Sales enablement is about providing the sales team with the resources they need to close more effectively. Whether it’s training programs, content, or tools, a well-structured enablement initiative can have a big impact on what the sales team can produce and how quickly when measured properly.
3. Technology adoption and process optimization
“Salespeople spend just 28% of their week actually selling, with most of their time consumed by other tasks like deal management and data entry.”
Rolling out the right technology tools and process improvements can also play a big part in improving the performance of a sales team. Using technology to automating repetitive workflows and optimizing processes to reduce time spent on things other than selling frees up salespeople to do what they do best—sell.
Supercharge your sales engine for sustained sales success
Understanding and measuring sales productivity with precision is the foundation to building a high-performance sales engine. Through a well-structured approach to continually analyzing sales productivity in real-time across various business dimensions, you gain actionable insights. This enables not only clarity on where your sales organization stands today but is also the core foundation for a cycle of continuous planning that informs tactical and strategic decisions moving forward.
Whether you’re making investment and hiring decisions, identifying areas for optimization, aligning resources, or evaluating the impact of new initiatives, a robust analysis of productivity serves as a critical sales performance management tool. It positions you and your sales team to hit your targets and achieve sustained success.
The biggest challenge for most Sales and RevOps teams is that historically there haven’t been any software tools to help simplify and automate this process. That’s why my co-founder Laura and I started Lative. Lative helps you connect plans to performance in real-time and turn your sales goals into sales reality.
To learn more, request a demo, contact us or install a free 30-day trial from the Salesforce AppExchange today. We’d love to hear from you!


